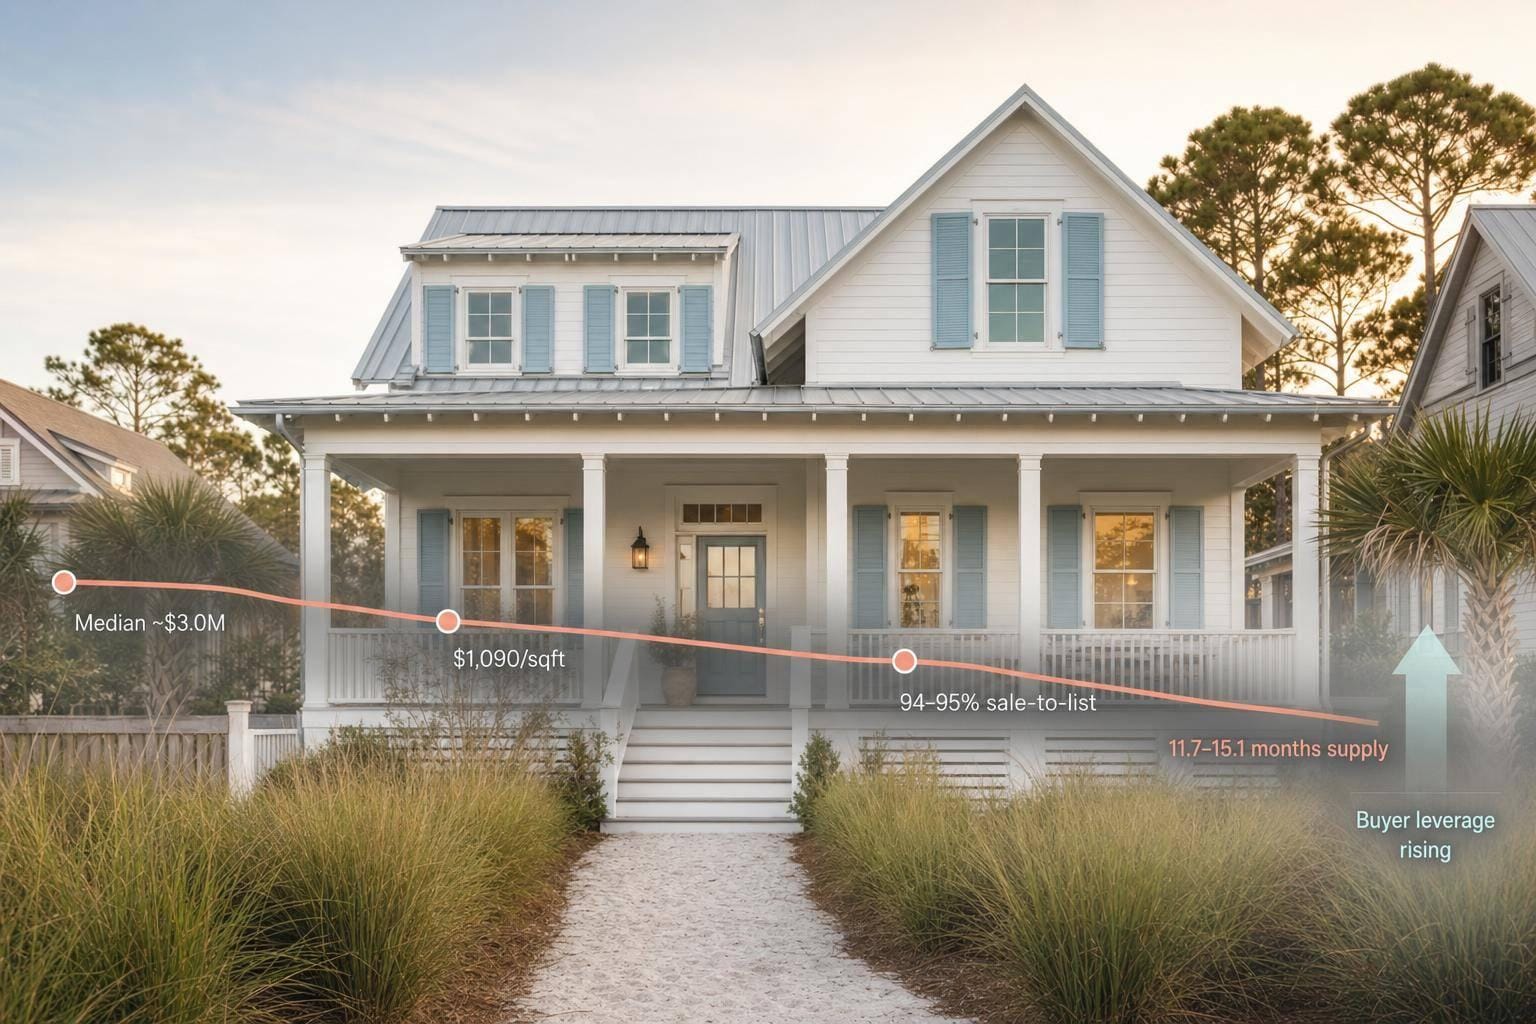
WaterColor homes are still priced near the top of 30A, but buyers now have more room to negotiate than headline prices may suggest. From the recent sales in this piece, I’d watch four numbers first: median sale price of about $2.9M to $3.15M, price per square foot near $1,090 to $1,099, sale-to-list ratios around 94% to 95%, and months of supply at 11.7 to 15.1 in the Santa Rosa Beach area.
If I were buying or selling here, I would not stop at the latest sale price. I’d also check original list price, days on market, pending sales, and where the home sits inside WaterColor. In this market, a 5% pricing gap on a $3,000,000 home is about $150,000, and that can change timing, offer range, and seller leverage.
Here’s the short version:
- Prices are still high: WaterColor closings sit around $2.9M to $3.15M
- Per-square-foot pricing stays elevated: about $1,090 to $1,099
- Negotiation room exists: many sales close near 94% to 95% of asking
- Supply is loose by area stats: 11.7 to 15.1 months of supply points to buyer leverage
- Location matters a lot: homes near the Beach Club, beach access points, Camp WaterColor, and Western Lake often trade at higher levels
- Costs go beyond price: buyers should check the $330 quarterly special assessment tied to Beach Club and Camp WaterColor work through 2030
- One month can mislead: trailing 12-month data gives a steadier read than a small batch of closings
Before you make a move, I’d keep my eye on inventory, pending contracts, same-area comps, and the gap between current ask and original ask.
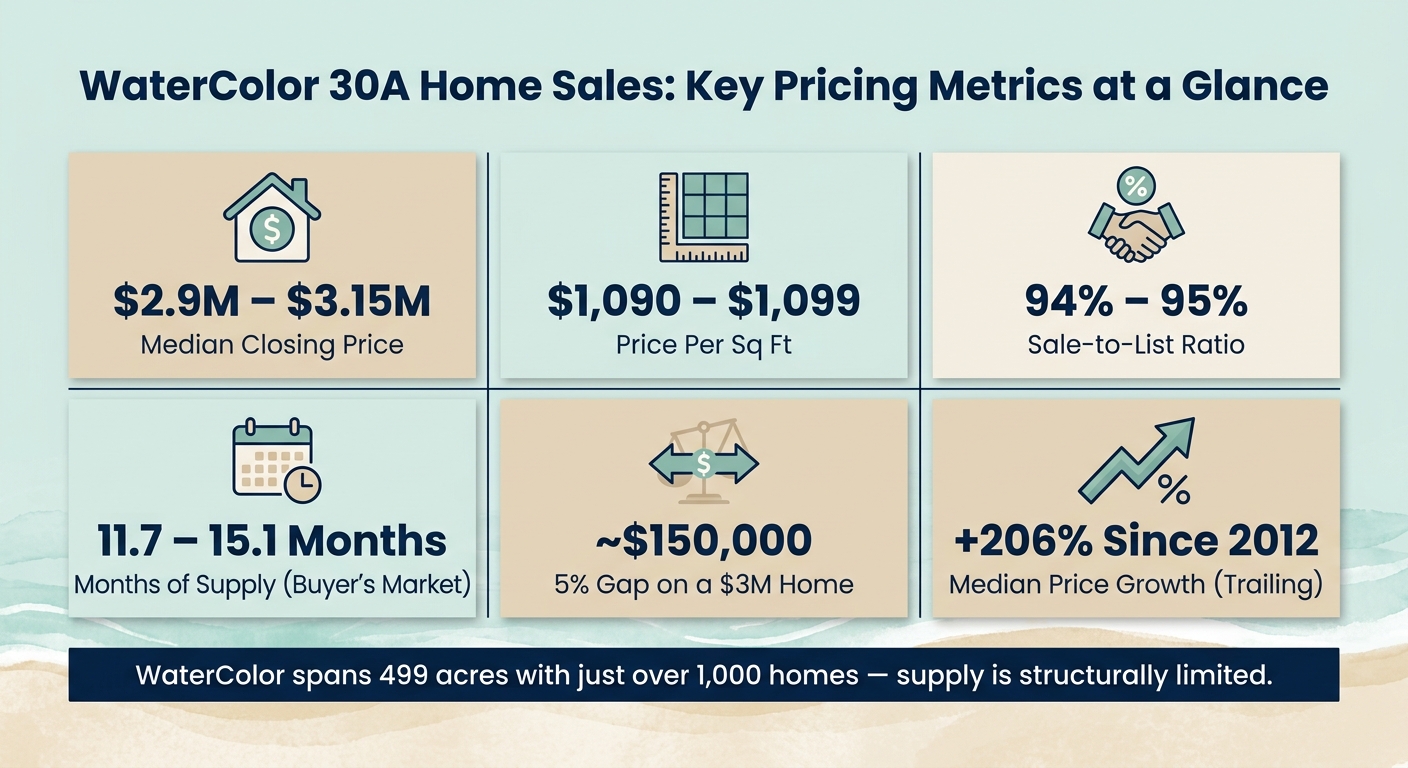
WaterColor 30A Home Sales: Key Pricing Metrics at a Glance
The Core Numbers Behind WaterColor Home Sales
WaterColor’s tight inventory and prime setting keep sale prices high. Homes with deeded beach access and spots closer to the shoreline usually command the top end of the market, and you can see that play out in the data. Those pricing patterns also show up in sale-to-list ratios and month-to-month movement, which the next section covers.
Median Sale Price and Typical Closing Range
The median sale price reflects WaterColor’s luxury market position. Limited inventory keeps the median above many 30A neighborhoods. Homes with deeded beach access and shorter distance to the shoreline usually land on the higher end because buyers place a clear premium on those features.
Price per Square Foot and What It Shows
Price per square foot helps show how much buyers will pay for access and location. Homes with deeded beach access and close shoreline proximity often post higher per-square-foot numbers. That makes it a useful way to compare homes of different sizes without getting lost in total price alone.
Days on Market and Market Speed
Days on market works as a signal of buyer demand. WaterColor’s amenity mix helps support that demand. Homes with deeded beach access and private pools often attract interest the fastest. That pace helps explain why WaterColor pricing can shift from one month to the next.
sbb-itb-d06eda6
Sale-to-List Ratios and Recent Monthly Pricing Shifts
What Sale-to-List Ratios Mean for Buyers and Sellers
In WaterColor, don't look only at the final sale price versus the current list price. You also want to compare it to the original asking price. Why? Because price cuts can make a deal look tighter than it was. A home may sell close to its latest list price, but still land well below where it first came to market.
For both buyers and sellers, that gives a better read on the actual negotiation range. And from there, the bigger issue is simple: Is that pricing strength holding up from month to month?
Month-to-Month and Year-over-Year Trend Lines
Month-to-month movement gives you a short-term snapshot. It shows what the market is doing right now, but it can swing based on a small batch of sales.
Year-over-year change is better for judging whether pricing is strengthening or softening. In WaterColor, beach access and the amenity mix help sustain premium resale values. That demand also supports resale values.
At the same time, inventory and pending sales help show whether those price gains still have room to continue. If supply starts building or pending activity slows, that can hint at a shift before headline prices fully react.
WaterColor vs. Walton County and Florida Statewide
Walton County and Florida statewide averages don't always tell the full story. They can blur what makes WaterColor different.
WaterColor tends to trade above less amenitized markets because of its beach access and resort amenities. So when you compare pricing, don't stop at the headline number. Supply levels and exact location inside WaterColor matter just as much as price itself.
What Buyers and Owners Watch Before Making a Move
After sale-to-list ratios and month-to-month changes, the next thing to watch is whether local supply can handle new demand.
Inventory, Pending Sales, and Months of Supply
Active listings, pending contracts, and months of supply can tell you a lot before closed-sale prices start to react.
In Santa Rosa Beach, which includes WaterColor’s 32459 ZIP code, months of supply hit 11.7 to 15.1 in early 2026. That points to a buyer’s market. At the same time, WaterColor has a built-in limit on supply. The community spans 499 acres and has just over 1,000 homes, so inventory can’t expand much even when more owners decide to sell.
Pending sales help show whether buyers are still stepping in. If pending activity stays steady, the market is absorbing inventory. If listings climb while contracts slow down, that usually signals cooling.
From there, the exact spot inside WaterColor starts to matter even more.
Location Differences Inside WaterColor
Not all WaterColor homes trade on the same level. Pricing changes by phase, distance to the beach, and access to key amenities.
Phase 1 homes near the WaterColor Beach Club tend to command the top premium. Homes close to Camp WaterColor or the Boathouse on Western Lake also draw stronger buyer interest.
There’s also a cost item buyers should check closely: a $330 quarterly special assessment that funds Beach Club and Camp WaterColor expansions through 2030. Before closing, confirm whether that assessment has already been prepaid or if it transfers with the sale. It can change your total carrying cost more than people expect.
Even then, home values don’t move in a vacuum.
Outside Forces That Affect Pricing Stability
Mortgage rates, insurance costs, HOA fees, and rental rules all shape demand and investor math. Short-term rental income matters too, along with tourism trends, management fees, and seasonality. Put together, those factors help explain why pricing may stay firm in one stretch and soften in another.
Conclusion: Key Pricing Signals to Track Next
WaterColor's recent median sale price is sitting around $2.9M to $3.15M, and recent closings put price per square foot near $1,090 to $1,099. Even small moves at that level can change the math fast. That's why the next signal to watch is the negotiation range.
In the 30A luxury segment, sale-to-list ratios have held near 94% to 95%. On a $3 million home, that 5% spread works out to $150,000. That's not a rounding error. It's the kind of gap that can shape both deal timing and leverage.
At the same time, monthly pricing by itself can give the wrong read. A single month can swing on just a handful of closings, especially in a market like WaterColor where deal volume isn't huge.
Trailing 12-month data gives a steadier view. It shows WaterColor's median down about 10% from its prior-year window, while still up about 206% since 2012. That frame tells you a lot more than one hot month or one soft month ever could. The next piece is supply, and whether inventory is lining up with current asking prices.
Use a few core signals to judge timing and room to negotiate:
- Active inventory
- Pending sales
- Months of supply
- Same-area comparables
Track fresh MLS data, inventory, and comparables before you price, make an offer, or start negotiating. In WaterColor, pricing can move faster than the headlines suggest.
FAQs
How much can buyers usually negotiate in WaterColor?
Buyers usually don’t have much room to negotiate in WaterColor. Sellers tend to stay firm, and homes often sell for about 92% of the original list price.
That said, there’s sometimes more room to work with listings that have been sitting on the market a bit longer. This is often the case with homes that need updates, since those properties are more likely to go through price cuts.
Why does location inside WaterColor affect pricing so much?
In WaterColor, location is one of the biggest pricing drivers because it affects both day-to-day lifestyle and rental income potential.
Homes closer to the Gulf, beach access, the Beach Club, Camp WaterColor pools, or Western Lake tend to draw more demand. In a large master-planned community like this one, walkability and easy access often matter a lot. That’s why homes in prime spots usually sell for more than similar homes tucked deeper into the neighborhood.
What market signals should I watch before buying or selling?
Watch four key signals in WaterColor/30A:
- Inventory / months of supply
- Sale-to-list and sold-to-original-list ratios
- Days on market
- Pending / new contract momentum
These numbers tell you how much leverage buyers may have. When supply gets tighter, homes move faster, and pending activity picks up, sellers usually have the upper hand. That often means less room to negotiate.
In late 2025, West 30A tightened to about 8.1 months of supply. Sale-to-list ratios were near 92%, compared with about 90% in East 30A.