
If I want better ROI from a 30A rental, I watch five numbers: occupancy, ADR, RevPAR, net income, and expense ratio. That’s the short answer.
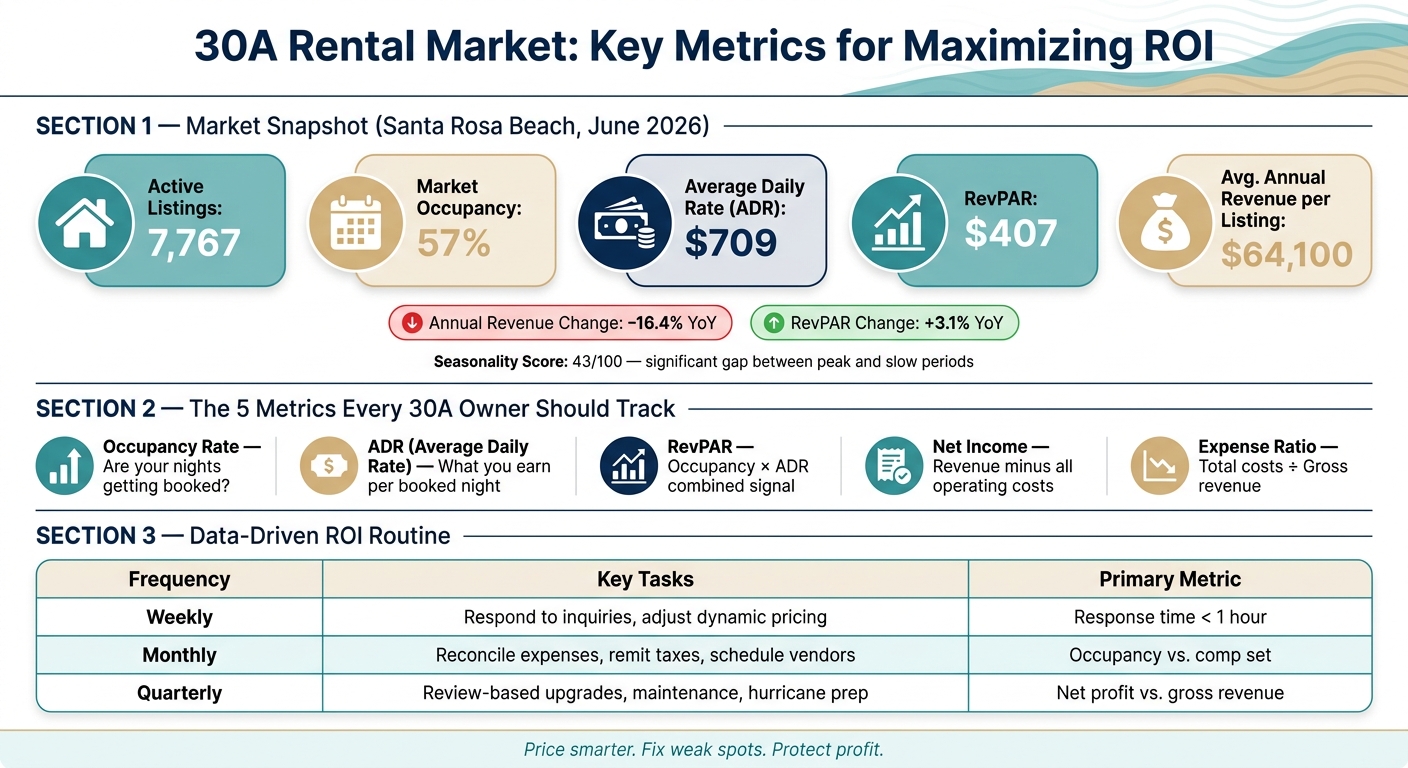
In Santa Rosa Beach, there are 7,767 active listings, market occupancy is 57%, ADR is $709, and RevPAR is $407 as of June 2026. At the same time, the market has a seasonality score of 43/100, which means the gap between busy and slow periods is hard to ignore. So if I price the same way all year, or I only watch gross bookings, I can leave money on the table.
Here’s the simple play:
- Track monthly performance instead of looking at bookings in isolation
- Compare my home to 5–10 close comps, not broad area averages
- Use a demand calendar for peak, shoulder, and slow periods
- Set a base rate, floor, and ceiling using local market data
- Adjust rates by booking window, stay length, and day of week
- Use reviews and booking behavior to decide what to fix or add
- Measure net profit, because high revenue can still mean weak returns
A few numbers from the article stand out:
- RevPAR in Santa Rosa Beach: $407
- ADR in Santa Rosa Beach: $709
- Occupancy: 57%
- Average annual revenue per active listing: $64,100
- Annual revenue change: down 16.4% year over year
- RevPAR change: up 3.1% year over year
That mix matters. More booked nights alone do not mean better ROI. And a high nightly rate alone does not fix soft occupancy. I need to watch both at the same time, then check whether costs are eating the margin.
If I had to boil the full article down to one line, it would be this: use market data to price better, use guest data to fix weak spots, and use expense data to protect profit.
Below, I’d turn that into a simple weekly, monthly, and quarterly routine.
30A Rental Market Key Metrics & ROI Dashboard (Santa Rosa Beach 2026)
What’s a Good ROI for Airbnb? | STR Investment Metrics Explained
sbb-itb-d06eda6
Step 1: Measure your property and the 30A market
Use your own numbers to tell the difference between a property issue and a market shift. Once you know which metrics matter, the next job is simple: compare your home's performance against the market instead of guessing.
Build a simple monthly dashboard
Track five monthly metrics: occupancy, ADR, RevPAR, net income, and expense ratio (total costs ÷ gross revenue). Use a trailing 12-month view to smooth out one-off jumps and dips. Then update the dashboard each month and compare it against Santa Rosa Beach benchmarks: 57% occupancy, $709 ADR, and $407 RevPAR.
This is where patterns start to show up. If your ADR looks solid but occupancy trails the market, that's often a pricing issue. If both numbers are soft, the problem may sit with your listing quality or your channel mix. Either way, those trends give you a clearer read on when pricing needs to move.
Map a 30A demand calendar
On 30A, some weeks book like a sprint and others crawl. Tie your booking pace to local event dates so you can spot demand spikes before they hit.
Use sowal.co's South Walton event calendar to flag school breaks and local events that lift demand. Then sort your calendar into three tiers: peak, shoulder, and slower periods. For each one, note the usual booking lead time.
That gives you a working demand map, not just a pile of dates. You'll use those tiers in Step 2 to set peak, shoulder, and slow-season rates.
Pick a comp set of similar nearby rentals
Santa Rosa Beach has 7,767 active listings as of June 2026. That's a big pool, which is exactly why broad averages can steer you wrong.
Instead, build a comp set of 5 to 10 properties that look as much like yours as possible, including:
- Same bedroom count
- Similar rate tier
- Similar amenities
- Similar review score
- Same nearby neighborhood
Skip countywide averages. They blur the differences between 30A submarkets.
After you pick your comps, compare how they perform during peak, shoulder, and slower periods. Check each property's minimum stay rules and cancellation policy too. Those details show how nearby hosts are positioning their rentals and where you may have room to take a different angle. Use this comp set as your pricing baseline in Step 2.
Step 2: Use demand data to set smarter pricing
Use your comp set and demand calendar to price with less guesswork.
Set a base rate, floor, and ceiling
Start with the $709 market ADR and adjust from there based on nearby comps with similar bedroom count, tier, and amenities. That gives you a pricing anchor based on a fair comp set, not a broad market average.
Then set two guardrails: a floor and a ceiling. Your floor should protect margin. Your ceiling should reflect what similar homes are actually getting during stronger demand periods. If your property beats nearby listings on amenities or bedroom count, charging more can make sense. If it doesn’t, stay close to the benchmark.
Adjust rates by season, booking window, and stay length
The market’s 43 seasonality score tells you pricing should move with demand - up in peak periods, down in slower months. And with 57% occupancy, pricing can’t focus on nightly rate alone. It also has to help keep nights booked.
Use higher rates during peak weeks, then pull pricing down in slower periods to keep demand from drying up. You can also fine-tune rates based on:
- Booking window
- Length of stay
- Day of week
Raise rates on nights that book fast. Lower them on nights that lag. The goal isn’t just a higher nightly rate. It’s better net return. Use seasonality, occupancy, and RevPAR together, and track whether your changes push RevPAR above the $407 market average.
Compare pricing tools for small portfolios
If you run a small portfolio, pricing software can save time without taking full control out of your hands. Look for tools that suggest rates but still let you set floors, ceilings, and event-specific overrides.
That way, automation helps protect margin while you test changes against your comp set.
Once rates are in place, the next step is to look at guest and operations data to see where higher pricing is easier to support.
Step 3: Use guest and operations data to improve profit
Pricing affects revenue. Guest experience and operating costs affect net profit. Once your pricing is in place, reviews and ops data tell you if the property can actually hold that rate.
Turn review patterns into property upgrades
Treat reviews like a data source, not just feedback. Review-mining tools can help you spot repeat complaints in your own listings and in nearby Santa Rosa Beach properties. When the same issue keeps showing up, that’s usually the thing dragging down ADR and repeat bookings.
Put your money into fixes that can improve ADR, occupancy, or review scores. If you compare your review scores with top-performing local property managers, you can often see where you’re falling short - cleaning, maintenance, or check-in - and which issue to fix first. Properties with fewer complaints can usually support better rates and stronger occupancy.
Try to time big upgrades for slower months.
Track booking behavior and amenity performance
Look at booking lead time, cancellation rate, and channel mix together. Those three metrics show which bookings are the best ones to win. Market data for 30A also includes minimum-stay rules and cancellation policies, and you can adjust both based on guest feedback to improve booking lead times.
When comparing amenities across a comp set, focus on features the market is already rewarding:
| Upgrade or Change | Why It Matters |
|---|---|
| High-speed Wi-Fi | A feature worth comparing against nearby listings with stronger ADR and occupancy |
| Upgraded bedding | Helps address comfort-related review themes |
| Beach gear package | A relevant amenity to test against local comps |
| Cleaning and maintenance improvements | Closes service gaps that show up in review benchmarking |
It also helps to track which channel each booking came from. That way, you can tune your listing photos and amenity descriptions to match the guest profile most likely to book on that platform. Once your amenities and policies line up with demand, compare the added revenue with the added cost.
Measure net profit, not just gross revenue
A month with strong revenue can still be a weak month if expenses eat up the margin. Track gross revenue against costs so you can see your actual net income.
Average annual revenue for an active listing in Santa Rosa Beach is $64,100. That makes it just as important to know where the money goes as how it comes in. Use net income to rank upgrades with better payback and operating changes that cost less. Then use that number to decide which upgrades and policy changes deserve more capital next month.
Conclusion: Build a simple data routine for better 30A ROI
The top 30A owners aren't always the ones with the nicest properties. More often, they're the ones who watch the right numbers and move fast. Pricing matters, but it only does its job when it's tied to cost control and guest experience.
The goal is simple: turn those signals into a weekly, monthly, and quarterly routine.
3 habits that drive better decisions
Three habits tend to lead to better decisions:
| Review Frequency | Key Tasks | Primary Metric |
|---|---|---|
| Weekly | Respond to inquiries, adjust dynamic pricing vs. fixed rates | Response time under 1 hour |
| Monthly | Reconcile expenses, remit taxes, schedule vendors | Occupancy rate vs. comp set |
| Quarterly | Review-based upgrades, preventive maintenance, hurricane prep | Net profit vs. gross revenue |
Measure on a steady schedule. RevPAR blends occupancy and ADR into one number, which makes it useful for spotting where things are slipping. If your RevPAR falls behind your comp set, start by checking pricing, occupancy, and expenses.
Set prices from actual data. Set seasonal rates by reworking your base rate, floor, and ceiling each quarter using your comp set, not broad market averages.
Use proof, not guesswork, for upgrades. Let review trends and net profit point to the next fix or update. Handle issues during slower months so you can protect higher rates and repeat bookings.
FAQs
How do I know if my pricing is too high or too low?
Monitor your booking pace and occupancy rates closely. If your property is 65% to 75% booked more than a month out, that’s often a sign your rates may be too low. On the flip side, if you still have big gaps inside the 30-day window while similar properties are filling up, your rates are likely too high.
It also helps to keep a close eye on your Average Daily Rate and occupancy on a regular basis. That way, you can see whether you’re bringing in the best possible revenue instead of guessing. Pair that with local market data from sources like sowal.co so you can stay on top of 30A trends and upcoming events.
What should I include in a strong comp set for a 30A rental?
Track 3 to 10 comparable 30A properties with similar bedroom counts, amenities, size, location, and beach proximity instead of leaning on broad market averages.
Watch ADR, occupancy, and booking pace closely. Also, put more weight on listings with review ratings of 4.7 or higher, since they often command rates 10% to 20% higher.
Which upgrades usually improve ROI the fastest?
For the fastest ROI gains in a 30A vacation rental, put your money into upgrades that can move the needle fast: private heated pools, extra bedrooms, and smart-home tech.
A private heated pool, in particular, can make a big difference. It can lift nightly rates by up to 25% and help bring in bookings during cooler off-peak months, when travelers still want that resort-style feel.
Professional photography matters too. Strong photos can make your listing look more polished, stand out in crowded search results, and support higher nightly rates.
If you self-manage, dynamic pricing tools can help you adjust rates in real time so you’re not leaving money on the table.