
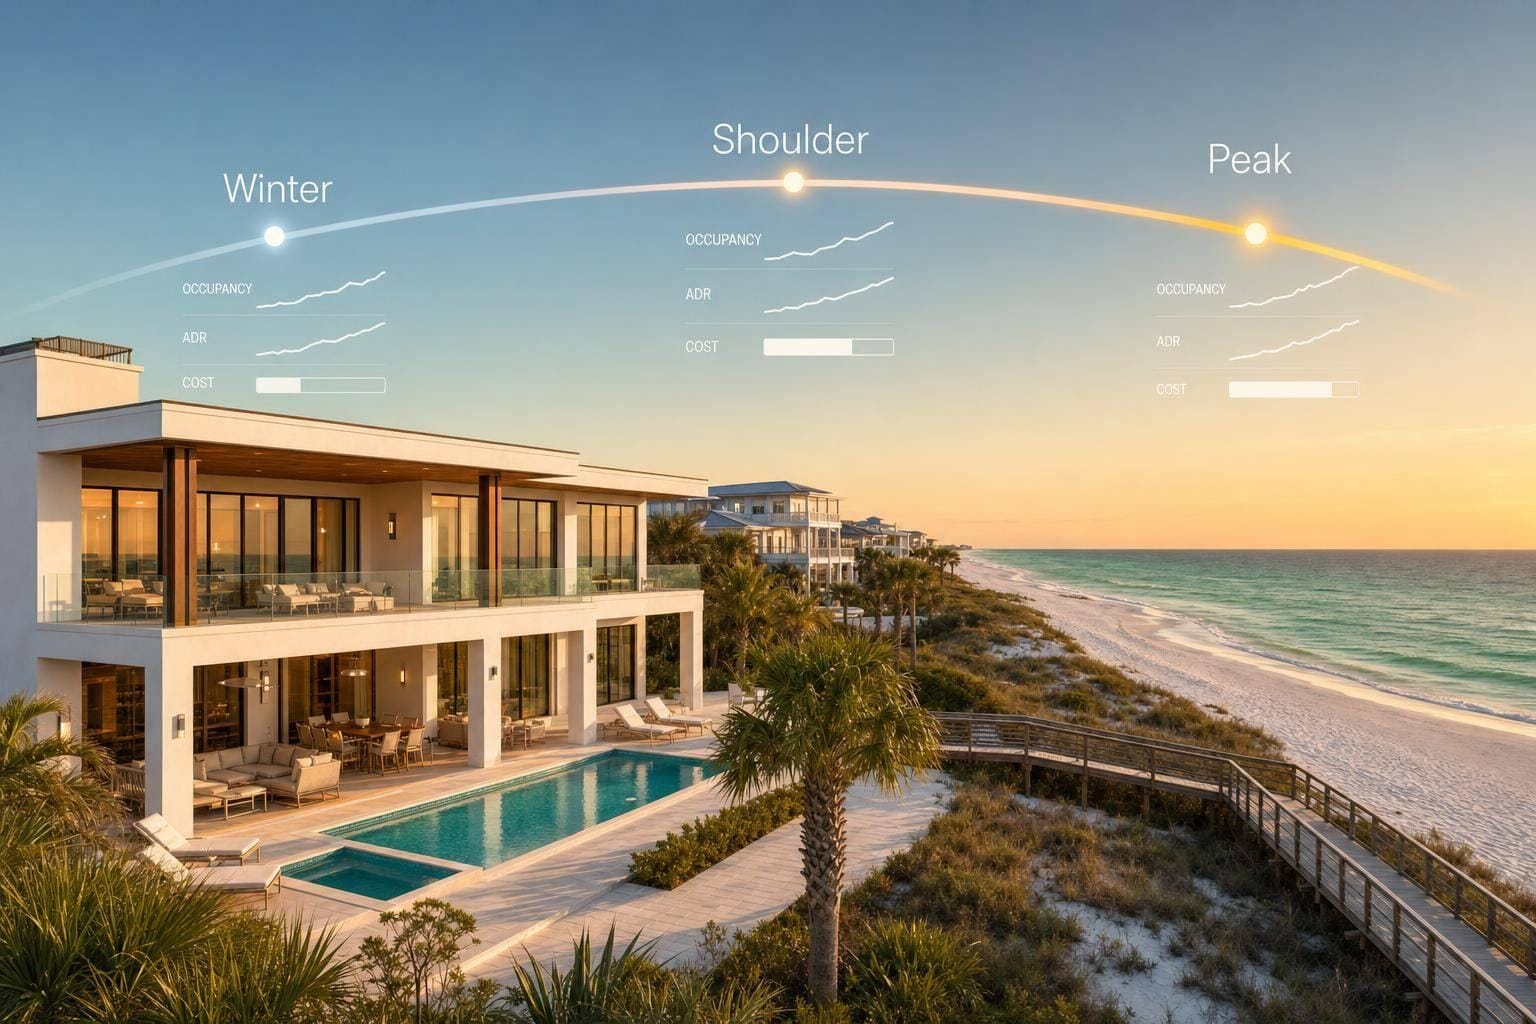
If you own a high-end 30A rental, annual return usually comes down to one thing: summer has to carry the year. In this market, high occupancy + strong ADR drive the best months, while winter often puts pressure on cash flow.
Here’s the short version:
- Peak season (June–August): highest occupancy and highest rates
- Shoulder season (March–May, September–November): solid bookings, softer pricing
- Slow months (December–February): lowest demand, fixed costs hit hardest
- ROI: depends on net income, not gross rent
A simple example shows why this matters. A home booked 24 nights at $850 makes $20,400. The same home booked 12 nights at $1,100 makes only $13,200. Higher ADR does not fix weak occupancy.
A few numbers set the tone for 30A:
- Summer 2025 Walton County occupancy: 69.1%
- Summer 2025 ADR: $500.54
- Winter 2025 occupancy: 31.9%
- Winter 2025 ADR: $196.10
So when I look at high-end rentals on 30A, I focus on three questions:
- How many nights get booked?
- What nightly rate holds in each season?
- How much income is left after costs?
Is the Easy Money Era of 30A Rentals Over?
sbb-itb-d06eda6
Quick Comparison
| Season | Occupancy Trend | ADR Trend | Revenue Outlook | ROI Pressure |
|---|---|---|---|---|
| Peak (June–August) | High | High | Best months of the year | Turnovers, cleaning, wear, and upkeep cut into margins |
| Shoulder (March–May, September–November) | Medium to high | Medium | Still strong for many homes | Dynamic vs. fixed pricing mistakes matter more |
| Slow (December–February) | Low | Low | Weakest stretch | Fixed costs take a bigger share of revenue |
Put simply: summer makes the money, shoulder season helps smooth the year, and winter tests the deal.
1. Peak Season (June–August)
Occupancy
Summer is the busiest stretch for 30A luxury rentals. In places like Rosemary Beach, Seaside, and WaterColor, luxury homes can hit 80%–90%+ occupancy during top summer weeks.
Not all homes perform the same, though. Gulf-front and beachside homes usually stay fuller than similar inland properties. And homes with beach access, private pools, and strong walkability tend to get booked first.
Summer guests also plan WELL ahead. Nearly 7 in 10 summer visitors to South Walton planned their trip at least three months before arrival , often using a South Walton itinerary generator to map out their stay, and the average booking window was 104 days. That matters because early reservations help build the occupancy base that supports summer ROI. They also give owners more room to hold firm on rates.
ADR
Summer is when ADR does the heavy lifting. Top-tier 30A homes in prime neighborhoods can bring in $1,000–$1,500+ per night during peak season, compared with the countywide $500.54 ADR recorded in Summer 2025.
A few features tend to push rates up:
- Beach access
- Private pools
- High-end interiors
- Larger bedroom counts
Still, high rates alone don't do the job. A premium ADR only pays off when occupancy stays strong. That's why many owners move to seven-night minimum stays in summer. It cuts down on turnovers and helps protect weekly revenue. At these rate levels, even a small dip in occupancy can hit monthly income hard.
Monthly Revenue
When high occupancy and high ADR line up, summer can drive a huge share of the year's income. A Gulf-side luxury home booked for 24 out of 30 nights at $1,200 per night would bring in $28,800 in one month.
For many individual luxury homes, June, July, and August make up the biggest slice of annual gross revenue. That's the season owners count on most.
Net ROI Impact
Big revenue doesn't always mean big margins. Summer demand pushes up variable costs, and those costs add up fast. Cleaning, pool service, landscaping, pest control, and HVAC maintenance all climb with back-to-back bookings and faster turnovers.
Heavy summer use also puts more strain on the home itself. Furnishings wear down faster. Exterior finishes take more abuse. Mechanical systems have to work harder.
So yes, summer often delivers the strongest gross revenue of the year. But net ROI comes down to how well owners manage turnover costs and maintenance pressure.
That changes a bit in shoulder season, where demand can still be healthy, but pricing gets less steady.
2. Shoulder Season (March–May and September–November)
Occupancy
Shoulder season on 30A still holds up well. In prime 30A communities, well-located luxury homes usually see 55–75% occupancy in spring and fall, compared with 80–95% during peak summer. That's a drop, sure, but it can still support solid yearly revenue.
Spring gets a lift from school breaks and weddings. Fall tends to bring in couples, festival-goers, and remote workers. And October often does better than September on both occupancy and rate. One big reason: by then, guests tend to feel less uneasy about hurricane season.
ADR
For high-end 30A homes, shoulder-season ADR usually comes in 15–30% below peak summer pricing. So if a home earns $1,200 per night in summer, that rate may fall to around $720–$900 in shoulder months. Late March and Easter can still push rates closer to summer levels.
Fall usually needs tighter pricing control. September often calls for a 20–30% discount off peak rates to bring bookings back after Labor Day. Then October can move rates closer to spring shoulder pricing as events and festivals pick up. Owners who change rates based on booking pace tend to do better than those who stick with a fixed seasonal calendar.
Monthly Revenue
Here’s what a shoulder-season month can look like for a 5-bedroom Gulf-view home. At 65% occupancy across 30 days, you’re looking at about 19–20 booked nights. With an ADR of $725, that works out to about $13,775–$14,500 in gross monthly revenue.
Put that next to a peak summer month: 85–90% occupancy at around $900 ADR can bring in roughly $22,950–$24,300. Even so, shoulder months can still land in the top five revenue months of the year.
ROI Pressure
This is where the math gets tighter. Fixed costs like property taxes, insurance, HOA fees, and management fees don't drop just because it's October. So every empty night matters more than it does in summer, when demand can cover small pricing mistakes more easily.
The main danger is mispricing either way. Cut rates too much, and ADR slips without much help on occupancy. Hold rates too high, and nights stay empty. In spring and fall, moving from weekly minimums to 3–4-night stays can help protect occupancy without giving up premium pricing.
That push and pull gets sharper in the slower months, when demand can fall faster than fixed costs.
3. Slow Months (December–February, Excluding Holiday Spikes)
Occupancy
Winter is the weakest revenue stretch on 30A. Walton County’s winter 2025 data shows 31.9% occupancy countywide, with an ADR of $196.10 and RevPAR of $62.56.
Luxury homes usually do a bit better than the county average. Even so, occupancy still tends to land in the high-20% range. In plain English, that’s only about 8–9 booked nights per month in January or February.
Some communities hold up better than others:
- Seacrest Beach: 44% winter occupancy
- Alys Beach: 43%
- Rosemary Beach: 42%
Those numbers are better, but guest demand is still low across the corridor. This isn’t just one rough season. It’s the normal winter pattern on 30A. And that matters because winter often decides whether summer profits still look good once you zoom out to annual ROI.
ADR
Winter ADR usually drops to about 40%–60% of peak summer pricing, or roughly $240–$480 per night for homes that rent for $600–$800+ in July.
Because of that drop, many seasoned owners stop chasing nightly bookings in winter and lean into monthly stays instead. A snowbird monthly rate for a well-appointed home might fall in the $4,000–$7,000 range. That’s much lower than peak summer on an effective nightly basis, but it comes with fewer turnovers and steadier cash flow. In many cases, monthly stays also lead to better net margins.
That’s why winter performance is less about the top-line nightly rate and more about whether you can lock in a monthly booking.
Monthly Revenue
The gap between summer and winter revenue is huge. A similar high-end home that brings in $20,000–$35,000+ in a peak summer month might produce only $3,800–$7,000 in January, depending on whether the owner lands a monthly stay.
Here’s where the math gets a little sobering. A three-month snowbird booking at $2,500/month brings in $7,500 total with just one turnover. By contrast, three months of nightly bookings at 20–28% occupancy may generate $6,000–$9,000 over the same period, but that can mean 8–12 turnovers and much more day-to-day friction.
So while the nightly route can sometimes post a similar gross number, the monthly-stay path is usually the better play on net income.
ROI Pressure
Winter can put real pressure on margins, especially when fixed costs stay the same and the home has higher-maintenance features. For leveraged buyers, this is where the numbers can shift fast if winter assumptions were too rosy.
A safer way to underwrite is to stress-test for scenarios as low as 20–25% occupancy, use conservative ADR assumptions, and build in a plan for snowbird bookings or short holiday spikes. That’s often the line between owners who get through slow months without much pain and owners who watch two or three empty February months quietly eat into a big chunk of their summer gains.
Those downside cases feed directly into the ROI scenarios below.
ROI Scenarios for High-End 30A Homes
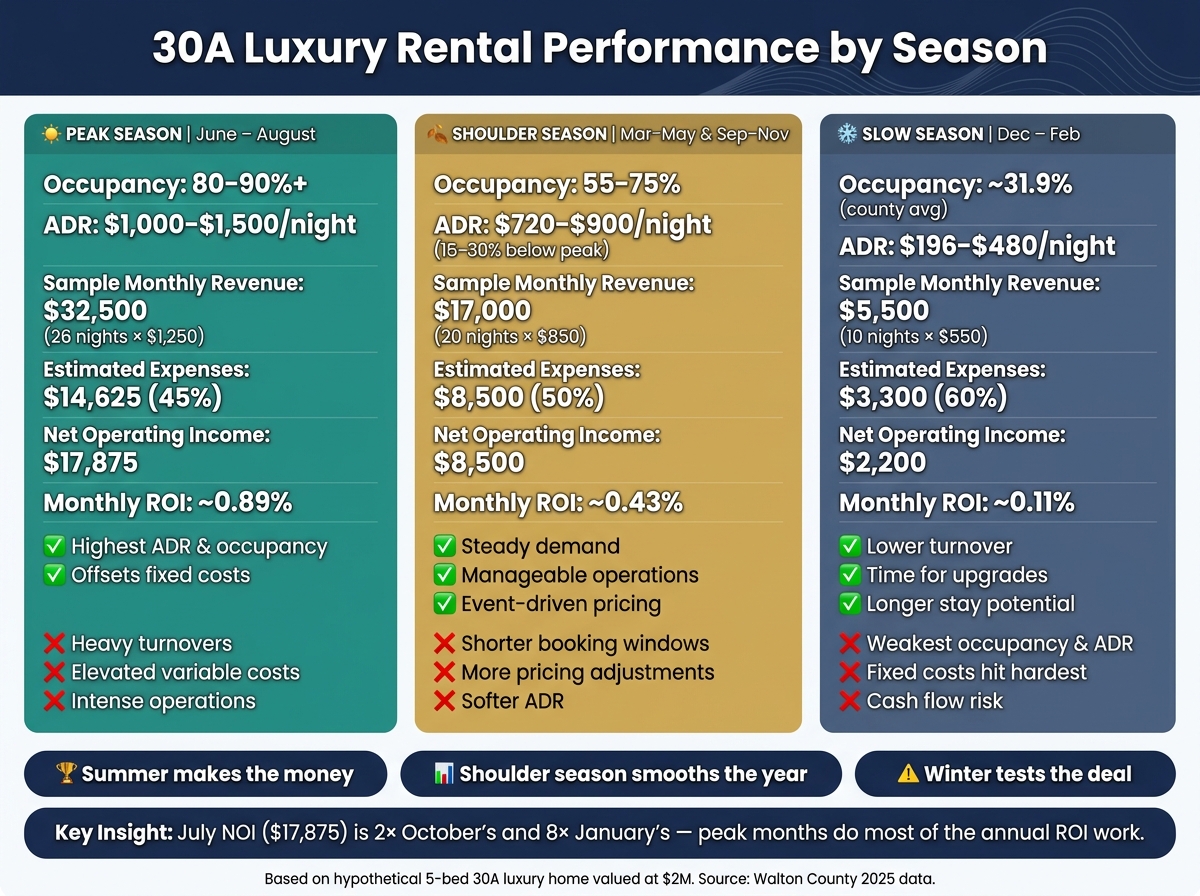
30A Luxury Rental Performance by Season: Occupancy, ADR & ROI
The seasonal demand swings above show up fast in NOI. Gross rent looks good on paper, but it doesn’t tell you what the owner keeps. Net income comes down to occupancy, ADR, and the costs that keep showing up even when bookings cool off.
How Occupancy and ADR Affect Net Operating Income
Two homes can post about the same annual occupancy and still end up with very different NOI. That’s the part a lot of people miss.
A beachfront home in a high-demand area like Rosemary Beach can produce much more NOI than an off-beach option, even if both are booked at a similar pace. The reason is simple: its ADR holds up better in both peak season and shoulder season.
If the beachfront home brings in about $350,000 in annual gross rent and the off-beach home brings in about $260,000, and both run at a 40% to 45% expense ratio, NOI could come in near $190,000 vs. $140,000. That’s a $50,000 gap, driven mostly by ADR, not occupancy.
In plain English: the stronger home doesn’t just book nights. It books better-paying nights.
The spread comes from both revenue and cost structure.
Monthly Scenarios for Peak, Shoulder, and Slow Periods
This hypothetical 5-bedroom home gives you a simple way to stress-test how bookings and ADR can change monthly NOI.
| Metric | July (Peak) | October (Shoulder) | January (Slow) |
|---|---|---|---|
| Booked nights | 26 | 20 | 10 |
| ADR | $1,250 | $850 | $550 |
| Gross revenue | $32,500 | $17,000 | $5,500 |
| Estimated expenses | $14,625 (45%) | $8,500 (50%) | $3,300 (60%) |
| Net operating income | $17,875 | $8,500 | $2,200 |
| Monthly ROI estimate* | ~0.89% | ~0.43% | ~0.11% |
*Based on a $2,000,000 home value or basis. Expense ratios rise in slow months because fixed costs take up a bigger share of lower revenue.
Cost Structure for Luxury Rentals
The main costs are pretty familiar:
- Management fees
- Housekeeping
- Maintenance
- Insurance
- Taxes
- Utilities
- Capital reserves
Here’s where it gets tricky. Fixed costs hit hardest when revenue drops. They don’t care whether the home is full or empty. That’s why margins get squeezed so much faster in slow months than the nightly rate alone would suggest.
What the Numbers Mean for Annual ROI
July’s $17,875 NOI is more than double October’s and more than eight times January’s. That gap says a lot.
Shoulder months like October bring in steady middle-tier income. They help carry fixed costs without the same level of turnover and wear that comes with peak season. January is a different story. Fixed costs eat up much more of the revenue, so slow months add very little to annual return. In some cases, they can quietly chip away at it if summer and fall haven’t already done the heavy lifting.
That’s why peak months do most of the work in annual returns, while slow months call for tight underwriting and realistic assumptions.
Those tradeoffs are easier to weigh in the season-by-season pros and cons below.
Pros, Cons, and Takeaways by Season
These season-by-season tradeoffs show why ROI depends on more than gross rent. Occupancy, ADR, and operating pressure all move together.
The math gets easier to see when you look at each season on its own.
Peak Season: Highest Revenue, Heaviest Operations
Peak season brings in the most revenue. Strong demand supports firm rates and high occupancy. But there’s a catch: it also drives up turnover and maintenance costs. Back-to-back check-ins, more cleaning, and faster wear on high-end furnishings can push variable costs higher, which squeezes margins even while gross revenue hits its high point.
Once summer demand cools off, pricing starts to matter more than raw occupancy.
Shoulder Season: Steady Demand With More Pricing Decisions
Spring and fall usually bring moderate, steady demand, but they also call for more active pricing. Fall 2025 county data shows 36.4% occupancy, a $329.77 ADR, and $120.04 RevPAR.
Shoulder season can still support ROI because occupancy often stays steady enough. The difference is that pricing discipline matters more here. With fewer back-to-back turnovers, owners get more breathing room to handle preventative maintenance. At the same time, owners who fail to adjust rates around local events or school breaks can miss extra income.
By winter, the pressure shifts away from rate tuning and toward cost control.
Slow Months: Lower Demand, Higher Fixed-Cost Risk
Winter is the toughest part of the year. Walton County's Winter 2025 numbers make that plain: 31.9% occupancy, $196.10 ADR, and just $62.56 RevPAR.
Fixed costs don’t stop when bookings slow down, so cash flow can get tight fast in January and February. That’s why slow months are often better used for upgrades and repairs instead of heavy discounting.
The same home can produce very different returns depending on how each season balances occupancy, ADR, and fixed costs.
| Season | Key Pros | Key Cons |
|---|---|---|
| Peak (June–Aug) | Highest ADR and occupancy; helps offset fixed costs | Heavy turnovers; elevated variable costs; intense operations |
| Shoulder (Mar–May, Sep–Nov) | Steady demand; manageable operations; event-driven pricing chances | Shorter booking windows; more frequent pricing adjustments; softer ADR |
| Slow (Dec–Feb) | Lower turnover; time for upgrades; potential for longer stays | Weakest occupancy and ADR; fixed costs hit hardest; ADR erosion |
Final Summary
Across the year, ROI improves when owners protect rate in peak months, price actively in shoulder months, and keep a close eye on costs in winter.
FAQs
What occupancy rate is considered strong for a luxury 30A rental?
For a luxury 30A rental, occupancy can look very different depending on the season and the type of home.
During peak summer, top-performing homes in places like Rosemary Beach, Seaside, and WaterColor often hit 80%–90% occupancy. That’s the sweet spot when demand is at its strongest and high-end homes tend to book up fast.
Across a full year, the best rentals usually stay above 67% occupancy. But even in the luxury tier, filling more nights isn’t the whole game. Occupancy needs to work hand in hand with dynamic pricing so you protect net returns instead of just chasing bookings.
How should I estimate winter cash flow before buying?
Start with 12–24 months of verified owner statements or profit-and-loss reports, not seller projections. That gives you a cleaner read on what the property has actually earned, not what someone hopes it will earn.
Make room for seasonality too. Winter occupancy often falls below 50% and can sink to 15%–23%. If you ignore that dip, the numbers can look better on paper than they do in your bank account.
Then add up your fixed costs:
- Mortgage
- Taxes
- Insurance
- HOA fees
After that, layer in variable costs like utilities. From there, run a conservative off-peak model. It’s the best way to see whether the deal still works when demand cools off.
You can also look at long-term rentals or dynamic pricing to help support cash flow during slower months.
Are monthly snowbird stays better than nightly winter bookings?
It comes down to your revenue goals.
Nightly winter bookings often mean lower occupancy once you get past the holiday rush. Monthly snowbird stays, on the other hand, can help fill slow-season gaps and bring in steadier income.
The trade-off is simple: long-term stays usually need a lower daily rate. That’s why a hybrid approach often makes the most sense. Focus on monthly snowbird stays first, then use dynamic pricing to go after higher nightly rates during peak holiday windows.